Stay up to date on the latest science with Brush Up Summaries.
What Is qPCR?
Quantitative polymerase chain reaction (qPCR) is a molecular technique that has reshaped the landscape of biological research and medicine due to its high sensitivity and specificity.
qPCR, also known as real-time PCR, is an extension of traditional PCR, where DNA amplification over time is quantitated by measuring fluorescence from dyes intercalating into nascent DNA strands or by cleavage of target-specific probes. Therefore, the method combines detection with amplification, providing researchers with crucial data in real time.1
Like PCR, qPCR amplifies DNA using a DNA polymerase enzyme. This adds new nucleotides to the 3’-OH end of a short, single-stranded DNA segment, called a primer, which complements the template strand.2 The reaction occurs in specialized thermal cyclers equipped with fluorometers that measure fluorescent signals, quantifying both relative and absolute DNA amounts when combined with reference values.
RT-PCR vs. qPCR
Reverse transcription PCR (RT-PCR) is often confused with real-time PCR. RT-PCR utilizes a reverse transcriptase enzyme to convert ribonucleic acid (RNA) into complementary DNA (cDNA).1 When combined with qPCR, the method is called reverse transcription real-time quantitative PCR (RT-qPCR).3 RT-qPCR is a powerful tool because it enables researchers to measure gene expression of specific genes using RNA as the template.
qPCR common applications
Real-time monitoring, high sensitivity, and specificity enable the precise measurement of genetic material and render qPCR invaluable for various applications. Some key examples are listed below.
- Gene expression profiling
- Pathogen detection
- Genetic variation studies
- Environmental monitoring
- Clinical diagnostics
How Does qPCR Work?
A typical qPCR reaction starts with a master mix containing DNA polymerase, deoxynucleotide triphosphates (dNTPs), primers, a dye or reporter, and template DNA.4 The reaction runs in a thermal cycler, programmed for approximately 35-40 amplification cycles, preceded by an initial denaturation phase.
Key qPCR cycle conditions
- Denaturation: DNA strands separate at a high temperature (94-98°C).
- Annealing: Primers bind to the specific target region of the template DNA (50-70°C).
- Extension: DNA polymerase generates two complementary DNA strands by adding nucleotides to the primers (68-72°C).
- Quantification: A fluorometer records the fluorescence emitted at the end of each amplification cycle.
Key qPCR detection methods
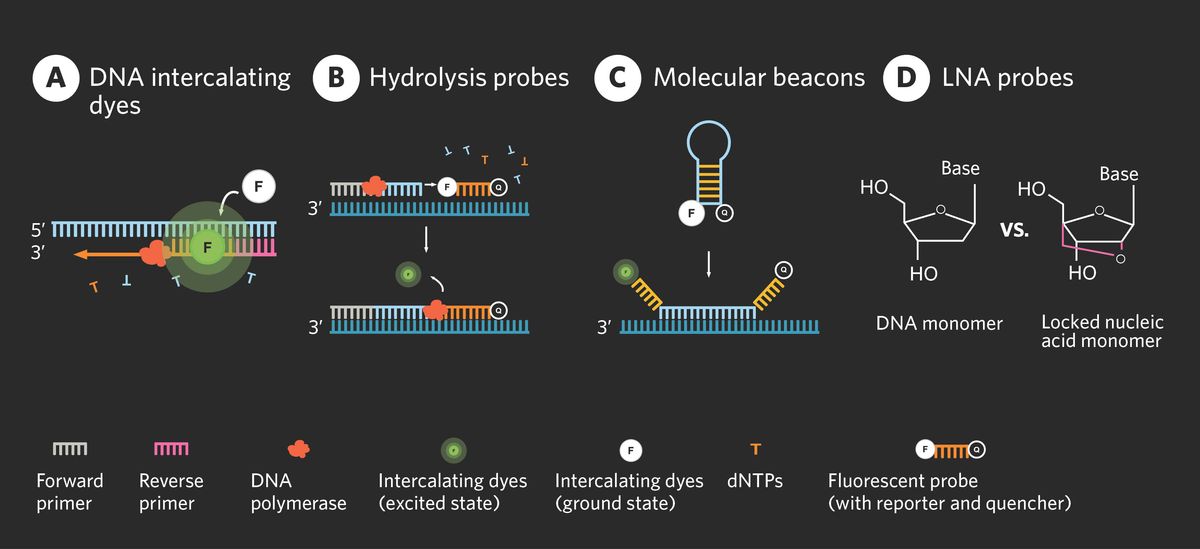
Scientists can employ several detection methods in qPCR experiments, depending on the specific application and the nature of the target molecule. Some common qPCR detection methods are described in the table below.
Table 1: Common qPCR detection methods with their pros and cons
Detection Method | Description | Pros and Cons |
DNA intercalating dyes |
| Dyes are versatile and cost-effective but have low specificity. |
Hydrolysis probes |
| The probes are highly specific but require precise and custom design. |
Molecular beacons |
| While highly versatile and specific, these can be complex to design. |
Locked nucleic acid (LNA) probes |
| While their specificity and thermal stability ensure precision in measurement, designing these probes often requires extensive optimization. |

Important qPCR controls
Appropriate controls in a qPCR assay ensure reliability and accuracy and help track any potential issues while providing a baseline for relative quantification.
Some important controls include the following.
- The no template control (NTC) contains all components of the master mix except the template. Any detected amplification suggests contamination from the sample.
- The negative control is sourced from the sample but lacks the gene of interest. It shows no amplification or may reveal non-target amplification.
- The positive control includes the sample template and no amplification suggests an error in the assay.
- The endogenous control is a housekeeping gene with consistent expression across experimental conditions and is crucial for relative quantification.
Key Considerations for qPCR Primer Design
Successful qPCR primer design is pivotal for specific and efficient amplification. Detailed below are some important considerations to bear in mind.6
- Ideally, primers should be 15-30 base pairs long (optimal for short amplicons, 70-200 bp).
- Design forward and reverse primers with similar melting temperatures (Tm), aiming for a Tm of around 60-65°C.
- The primer ends should be GC-rich to allow efficient template binding and high melting temperatures. Design primers with 40-60 percent GC content to enable primer specificity, stability, and optimal amplification.
- The annealing temperature should be about 5°C lower than the Tm of the primer pair to prevent non-specific amplification.
qPCR Analysis, Ct Value, Standard Curve, and the ΔΔCt Method
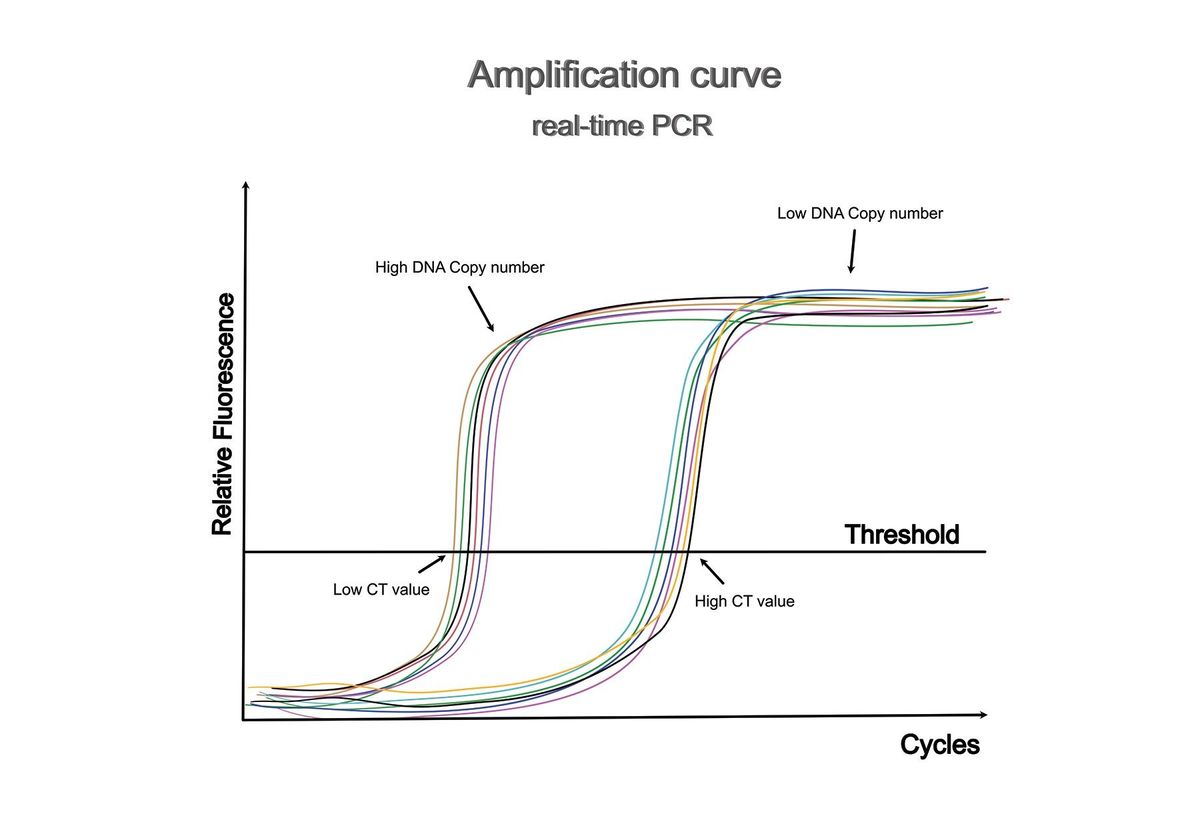
Analyzing results from qPCR centers on an amplification plot, which charts the cycle number against the fluorescent signal. Initial qPCR cycles with minimal amplification and relatively low fluorescent signals form a baseline for analysis. At a specific cycle number, known as the threshold cycle (Ct), the fluorescent signal exceeds the baseline.

Scientists can quantify qPCR results using either absolute or relative quantification. Absolute quantification determines the total target DNA or RNA in experimental samples based on a standard plot. Relative quantification determines changes in the sample relative to a reference, typically an untreated control, utilizes endogenous genes with consistent expression, and can be measured using a standard curve7 or a comparative ΔΔCt method.8
- The standard curve method uses five or more data points and serial dilutions of the same template, such as previously quantitated plasmid DNA, PCR products, or synthetic DNA.
- The comparative Ct method involves relative quantification (RQ) of a target gene's expression levels using an endogenous reference gene, typically a housekeeping gene with consistent expression across experimental conditions The formula for calculating RQ is as follows.
RQ = 2−ΔΔCt
ΔΔCt = ΔCt (treated sample) − ΔCt (untreated control)
ΔCt (treated sample) = Ct (target gene in treated) − Ct (reference gene in treated)
ΔCt (untreated control) = Ct (target gene in untreated) − Ct (reference gene in untreated)
In conclusion, qPCR is a pivotal technique in molecular biology, enabling precision nucleic acid quantification and supporting various applications such as genetics, diagnostics, and beyond.
References:
- Adams G. A beginner’s guide to RT-PCR, qPCR and RT-qPCR. Biochem (Lond). 2020;42(3):48–53.
- Ishino S, Ishino Y. DNA polymerases as useful reagents for biotechnology - the history of developmental research in the field. Front Microbiol. 2014;5:465.
- Udvardi MK, et al. Eleven golden rules of quantitative RT-PCR. Plant Cell. 2008;20(7):1736-1737.
- Yang J, et al. The source of SYBR green master mix determines outcome of nucleic acid amplification reactions. BMC Res Notes. 2016;9:292.
- Zipper H, et al. Investigations on DNA intercalation and surface binding by SYBR Green I, its structure determination and methodological implications. Nucleic Acids Research, 2004;32(12):e103
- Bustin S, Huggett J. qPCR primer design revisited. Biomol Detect Quantif. 2017;14:19-28.
- Larionov A, et al. A standard curve-based method for relative real-time PCR data processing. BMC Bioinformatics. 2005;6:62.
- Livak KJ, Schmittgen TD. Analysis of relative gene expression data using real-time quantitative PCR and the 2(-Delta Delta C(T)) Method. Methods. 2001;25(4):402-408.

